
X-ray crystallography is the use of x-rays to determine the molecular structure of crystals. This underlying atomic structure can then be used to determine physical properties such as elasticity, tensile strength, conductivity, or superconductivity, making it an important tool for materials science. X-ray crystallography involves mounting a crystalline material on a platform, blasting it with x-rays at various angles and measuring the intensity of the reflected rays.
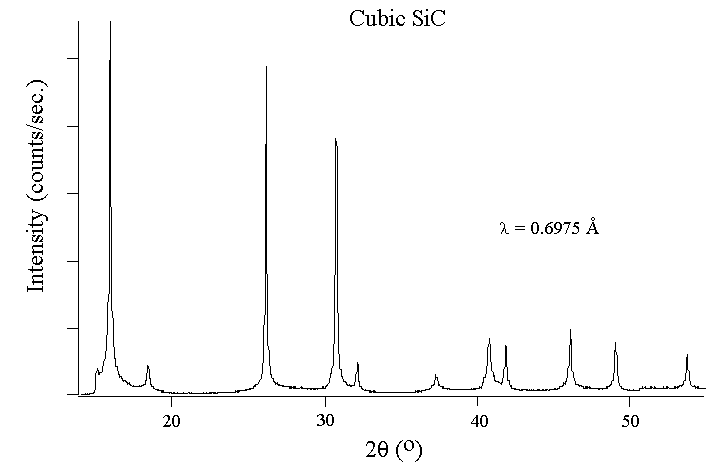
The graph of intensity against x-ray angle is referred to as the diffraction pattern, the peaks of which are used to determine atomic structure. Below is the diffraction pattern of silicon carbide.
However, considering there are an infinite number of possible alloy combinations, looking through all of them to find the ideal crystalline structure for a given use case is infeasible. This makes it an excellent place to employ a machine learning algorithm.
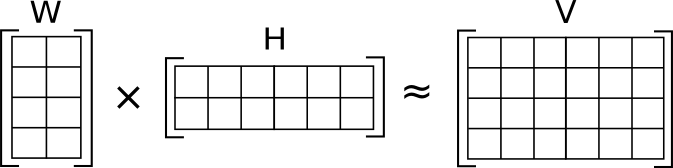
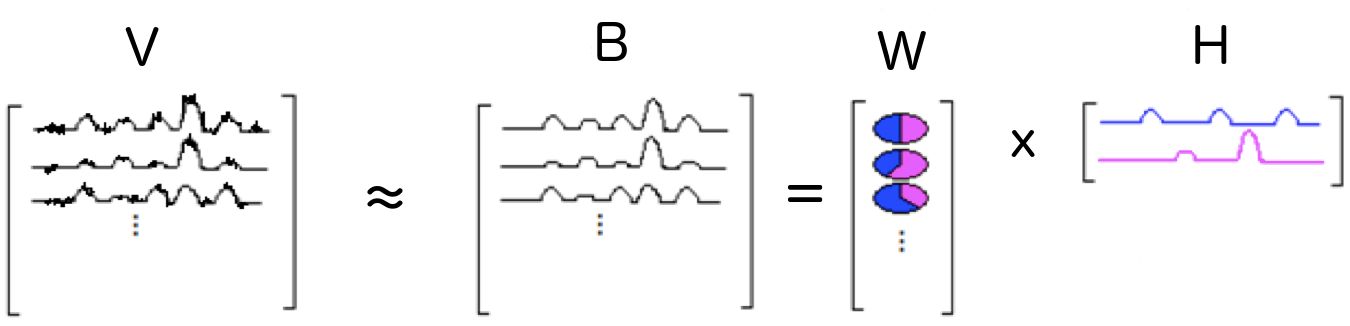
Non-negative Matrix Factorization is frequently used in recommendation systems, but is also uniquely well suited for deriving patterns from signal data. The basic principle is to represent all the signals as a matrix of values V, each row of numbers representing a single signal. The matrix factorization process then produces matrices W and H where W multiplied by H is an approximation of the original matrix V.
Another way of imagining this is as H, a series of base signals, and W the percentages of each of those base signals combined to produce B, the approximation of V.
In NMF, the goal is to minimize the error between the actual and derived signal matrix. Put another way, to minimize the Frobenius norm of the error matrix.
One way of achieving this is using alternating least squares. In alternating least squares only one of the two matrices, W or H is updated to minimize the Frobenius norm each iteration. This is in contrast to gradient descent in which both are updated each iteration to approach a minima of the Frobenius norm. Via differential calculus, the following update equations can be derived.
Regularization can also be added for desired properties such as matrix sparcity. Since the most important aspects of the diffraction patterns are the peaks, most values in the base signals should be geared towards 0.
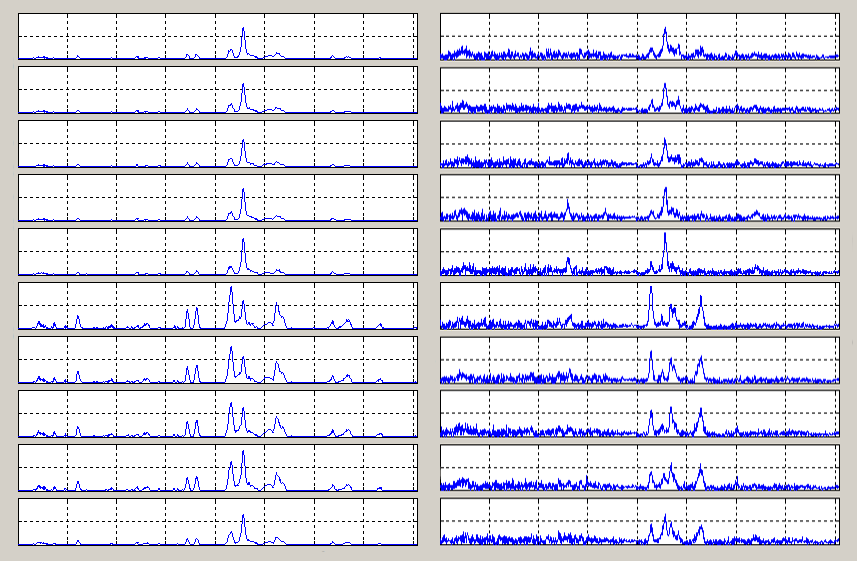
This process was applied to the Iron-Palladium-Galium alloy combinations and written up in a paper coauthored while working at NIST. Below is shown some derived signals from the W and H matrices, next to the experimental data.
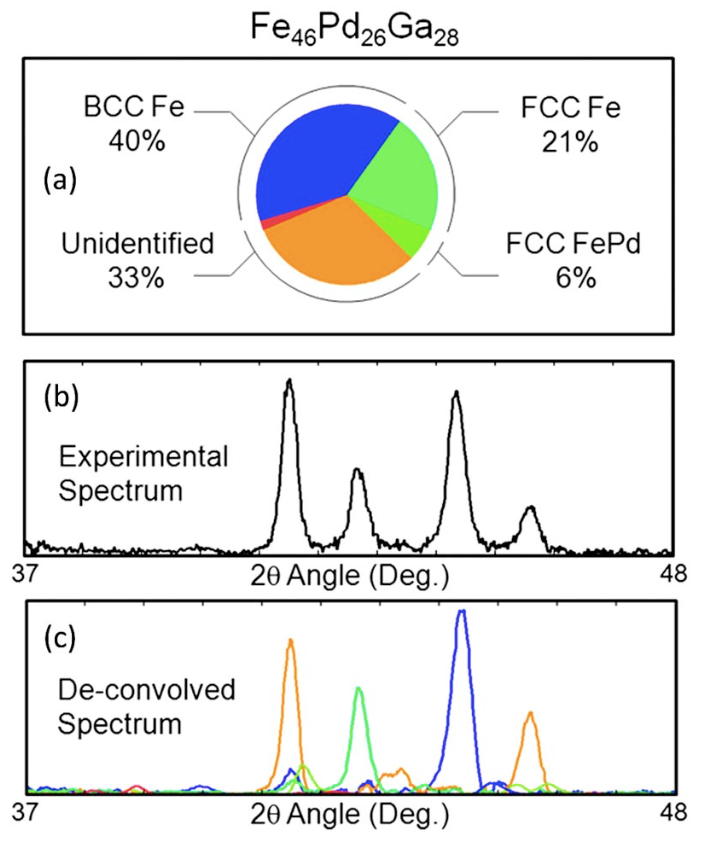
Here is an example of 46% Iron, 26% Palladium and 28% Gallium. The percentage of each structure is shown as a slice of the pie. Each of the known structures are labeled and the de-convoluted signal is at the botom.
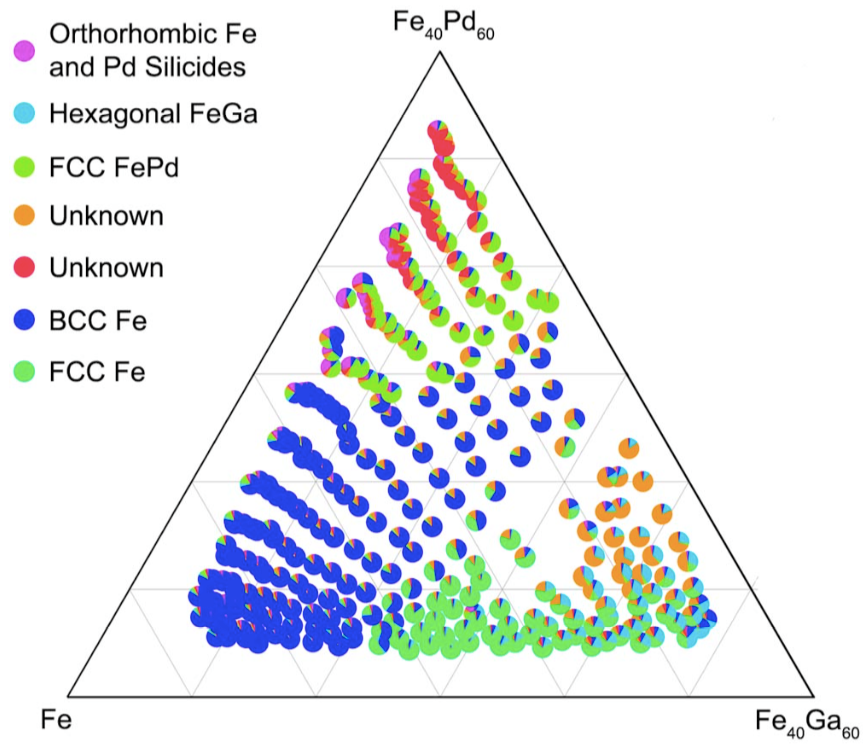
The results can be represented as a triangle of pie charts, the location of the pies showing the alloy composition and the slices of each pie representing percentages of the base signals.
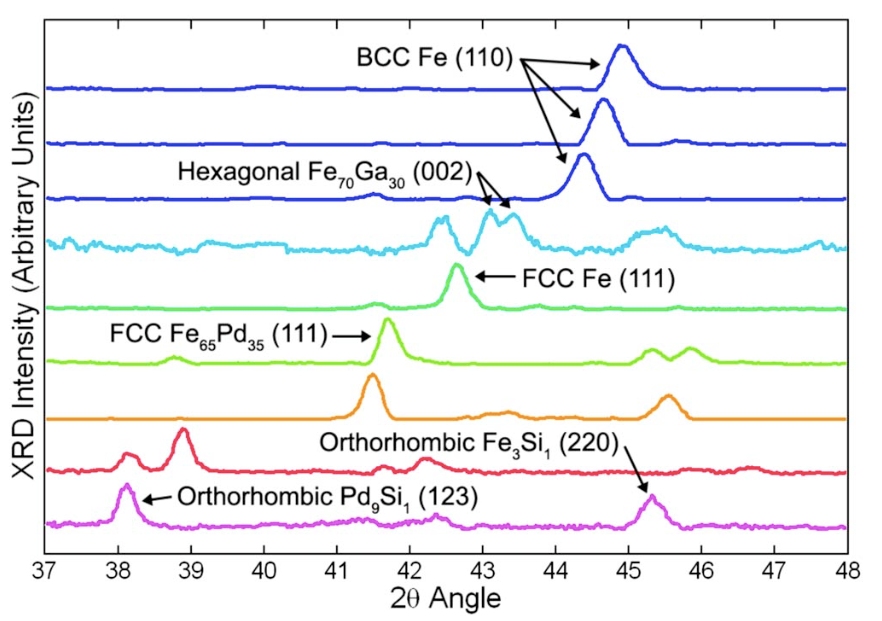
One of the problems with using NMF for base diffraction pattern derivation is phase shifts. As the composition moves from mostly one type of atom to another, atoms will be swapped, though the crystalline structure may not change. This results in the peaks moving and NMF generating a new base signal when it should reuse one already generated as can be seen in BCC Fe (110). Despite phase shift deviations, NMF is useful in deriving base diffraction patterns and visualizing the results.
Resources:
1) C. J. Long, et al. Rapid identification of structural phases in combinatorial thin-film libraries using x-ray diffraction and non-negative matrix factorization, 2009
2) P. O. Hoyer, et al. Non-negative Matrix Factorization with Sparseness Constraints, 2004
3) P. Dai, et al. Synthesis and neutron powder diffraction study of the superconductor HgBa2Ca2Cu308 by T1 substitution, 1994